Sleep Cycle
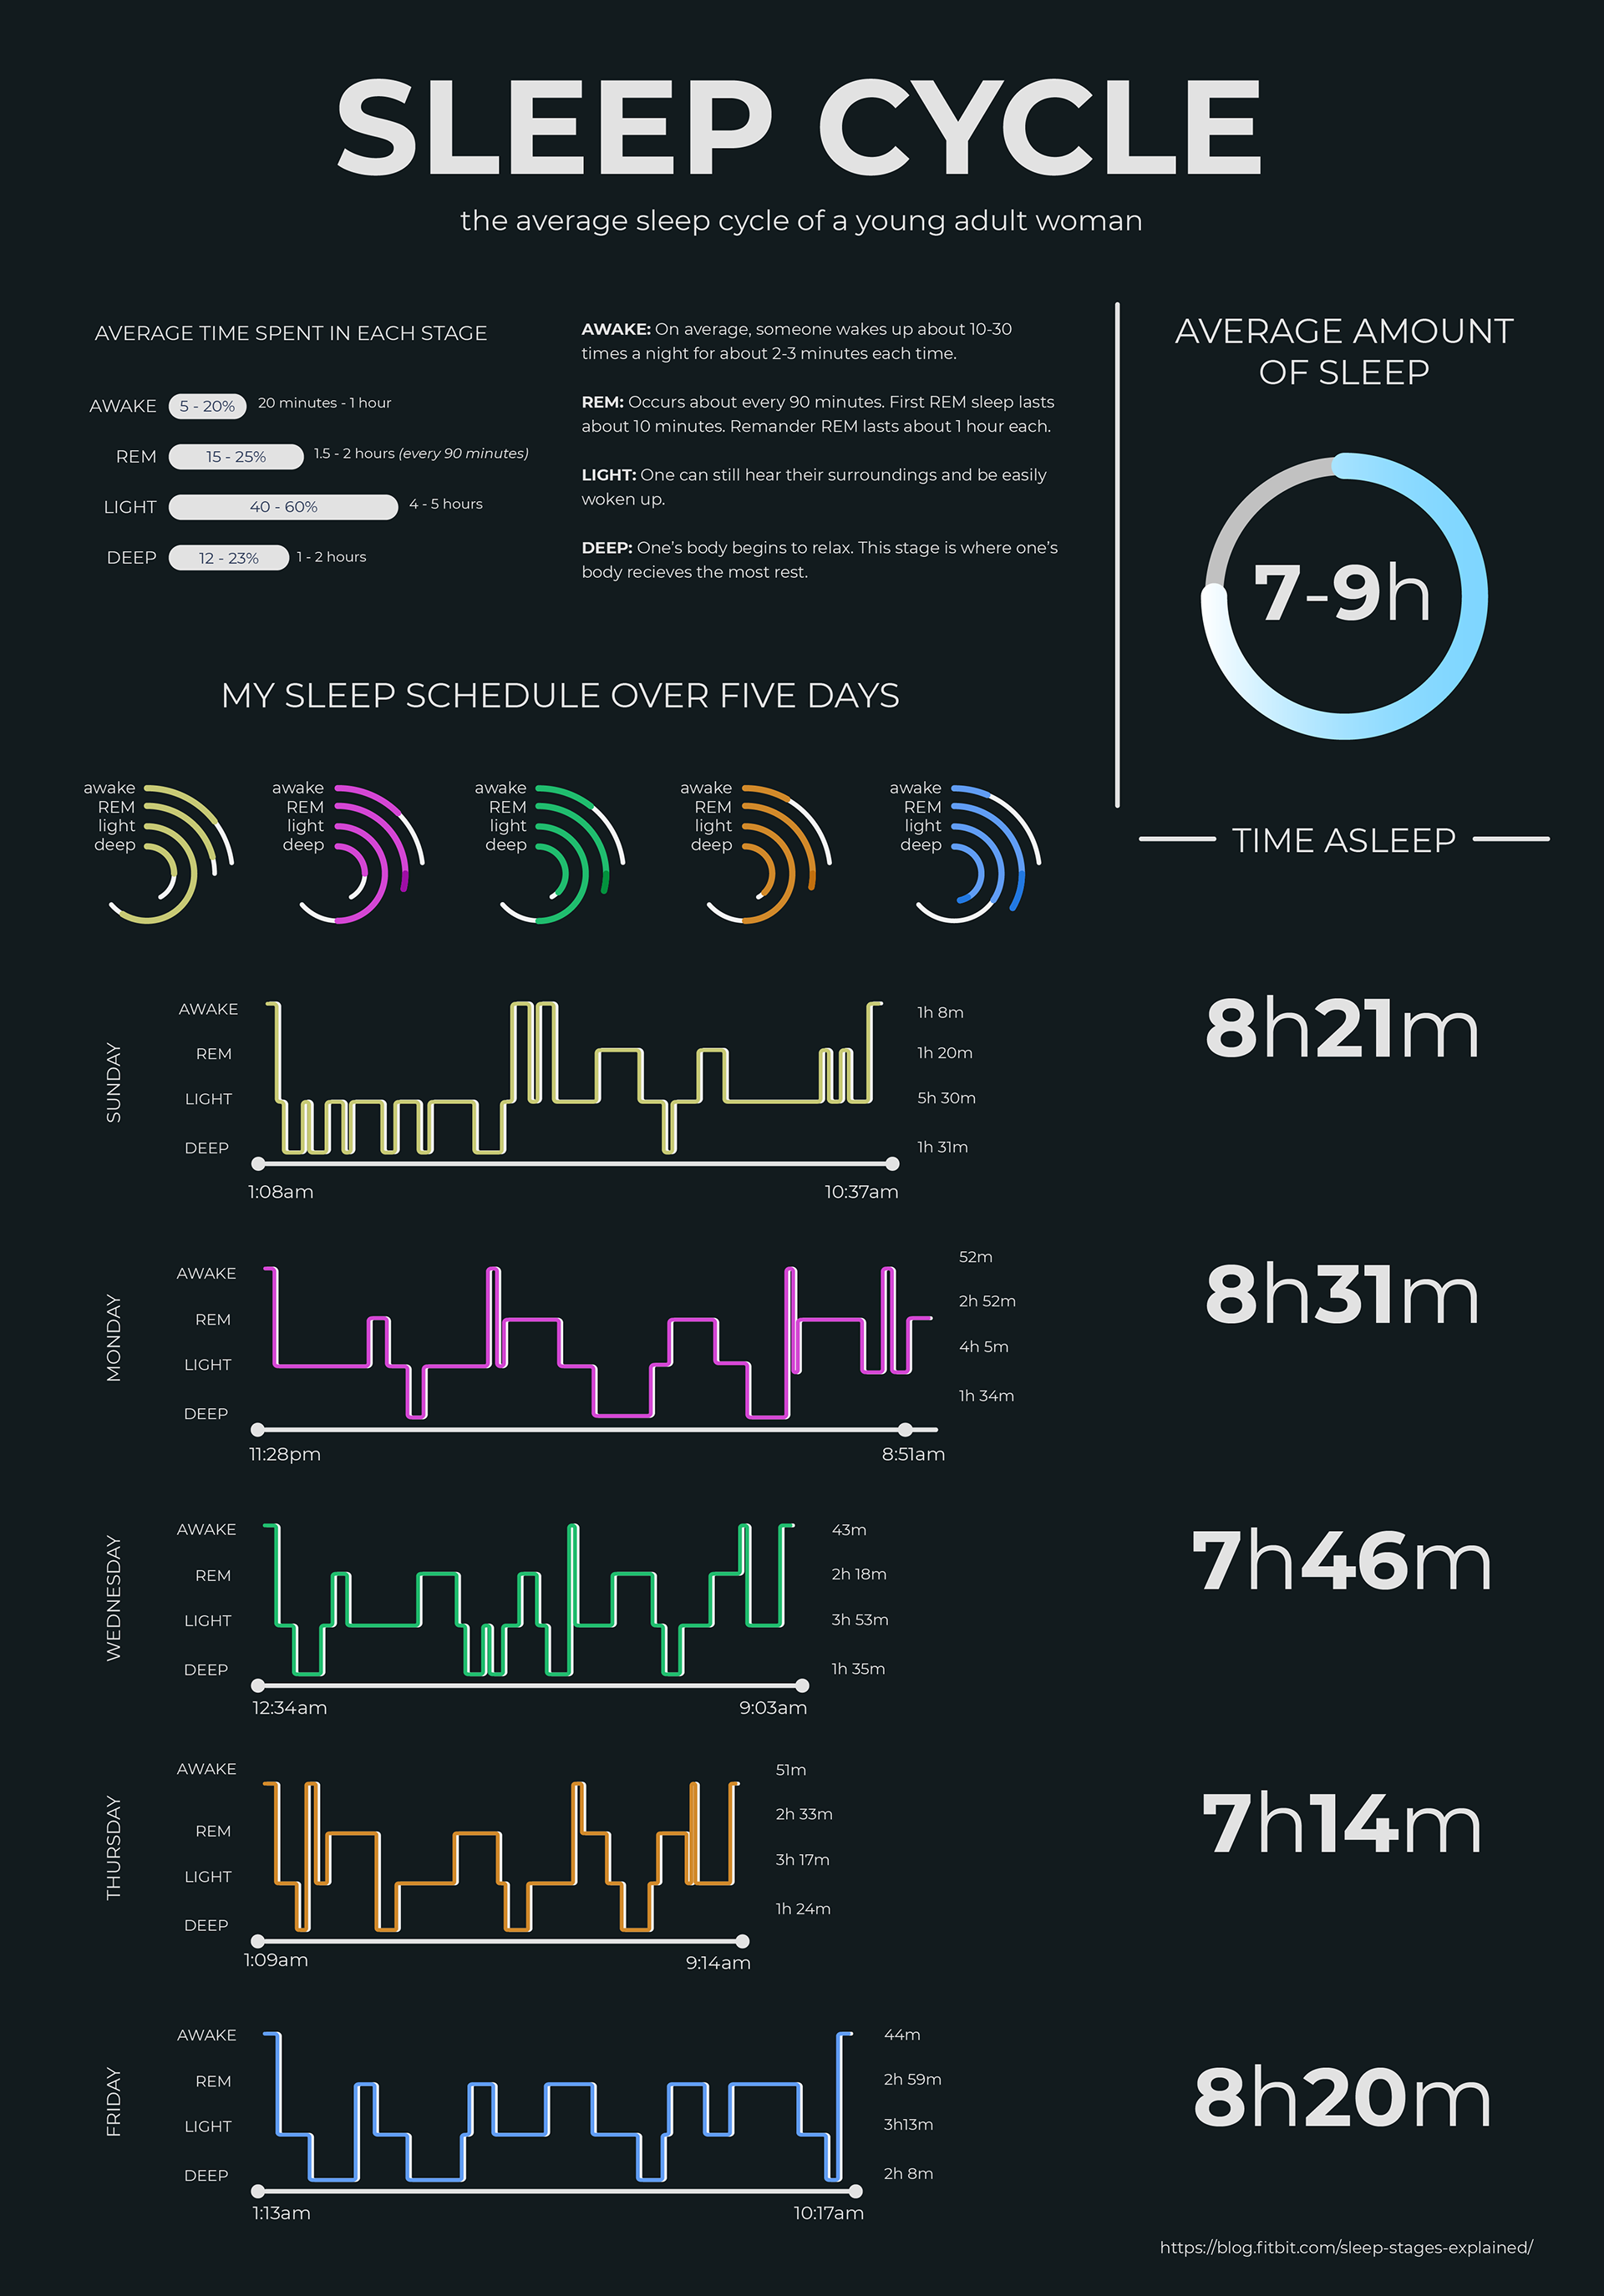
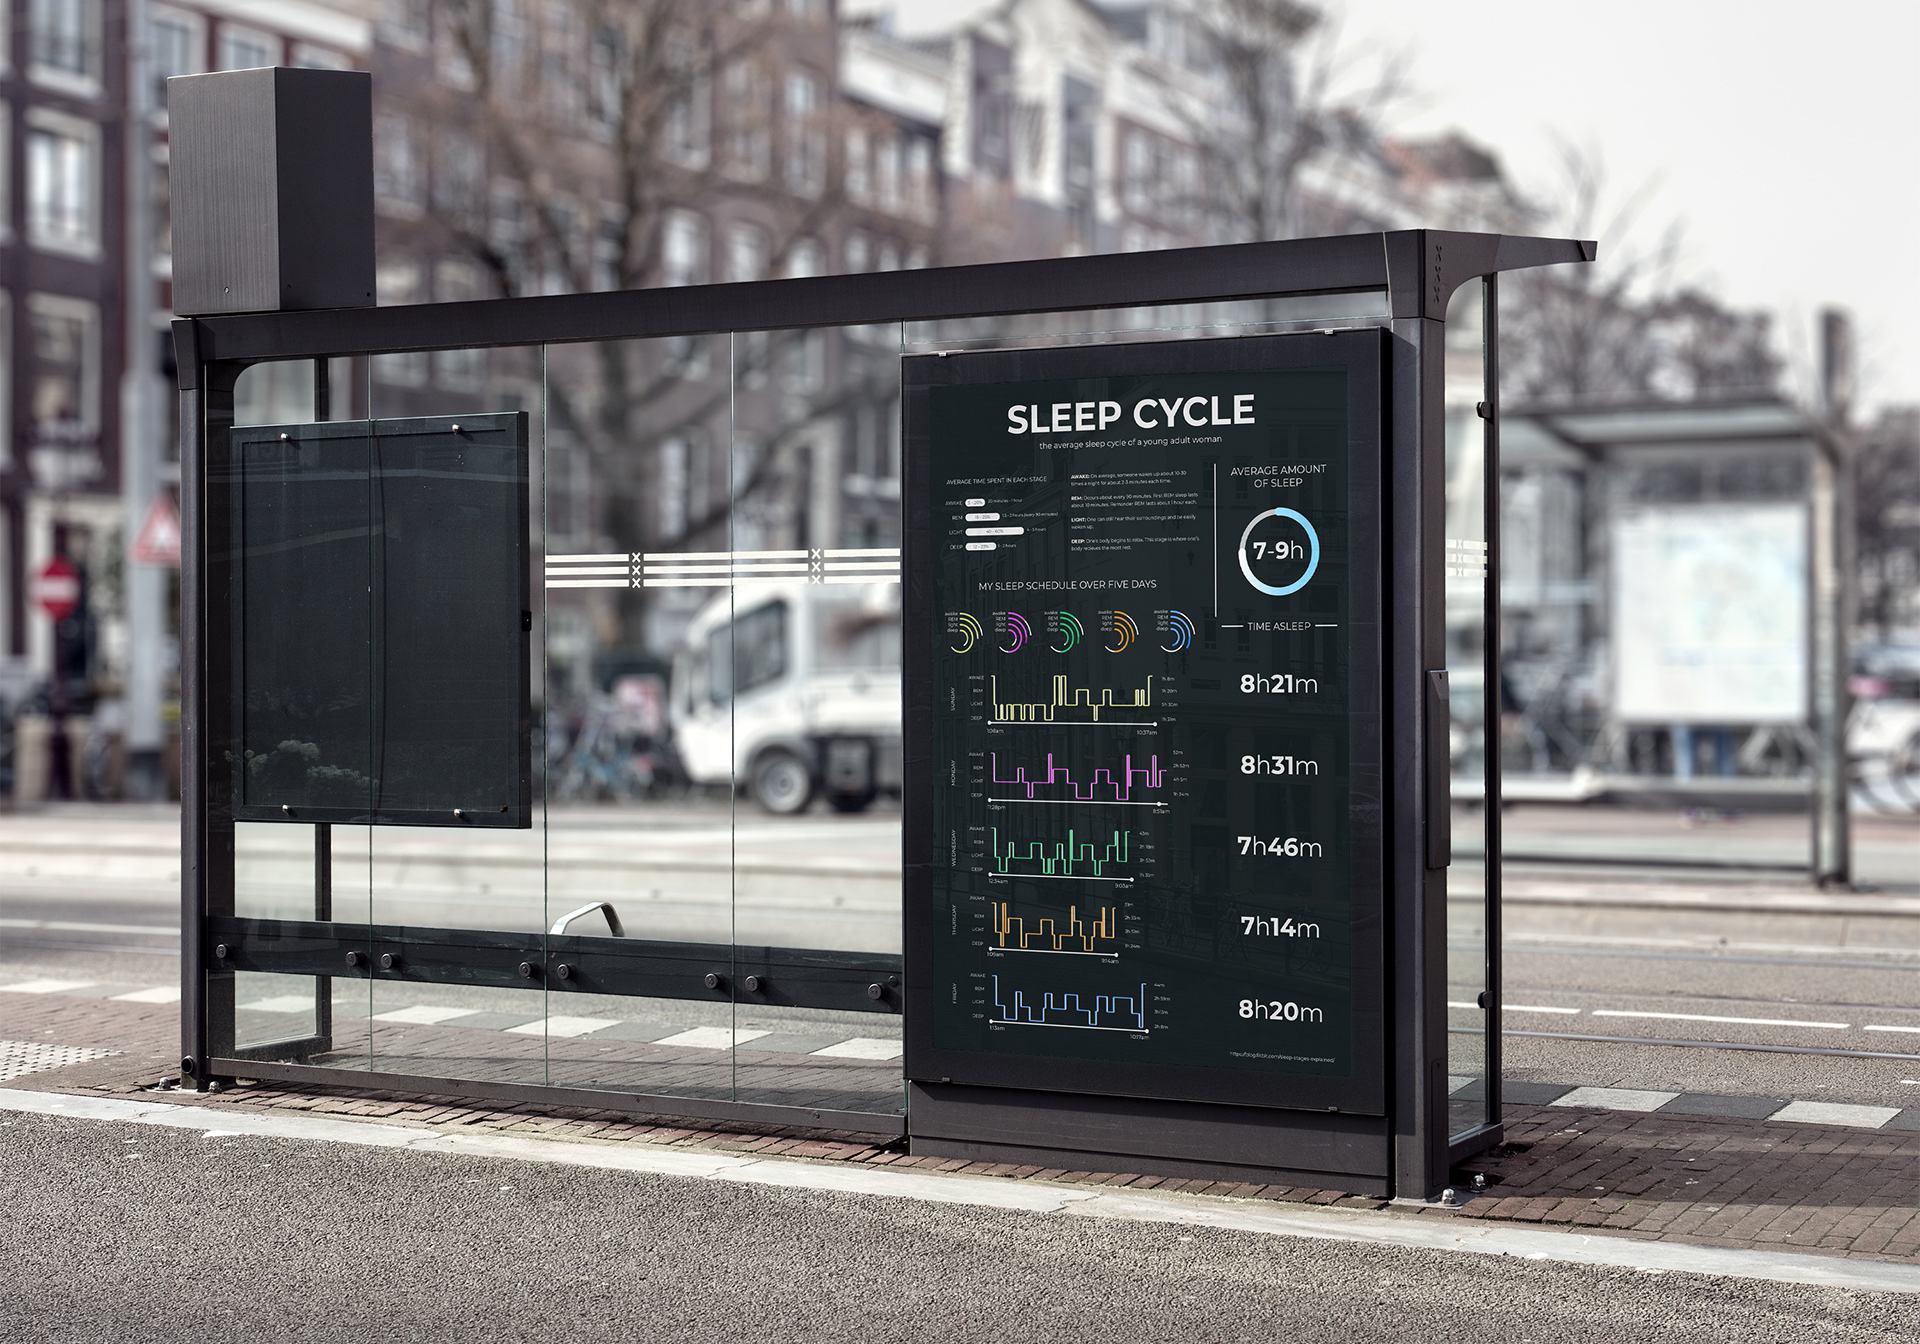
For Information Design, I created an info graphic based on something I do a lot of. I thought it would be interesting to track my sleep patterns and the number of hours I slept each night for a week.
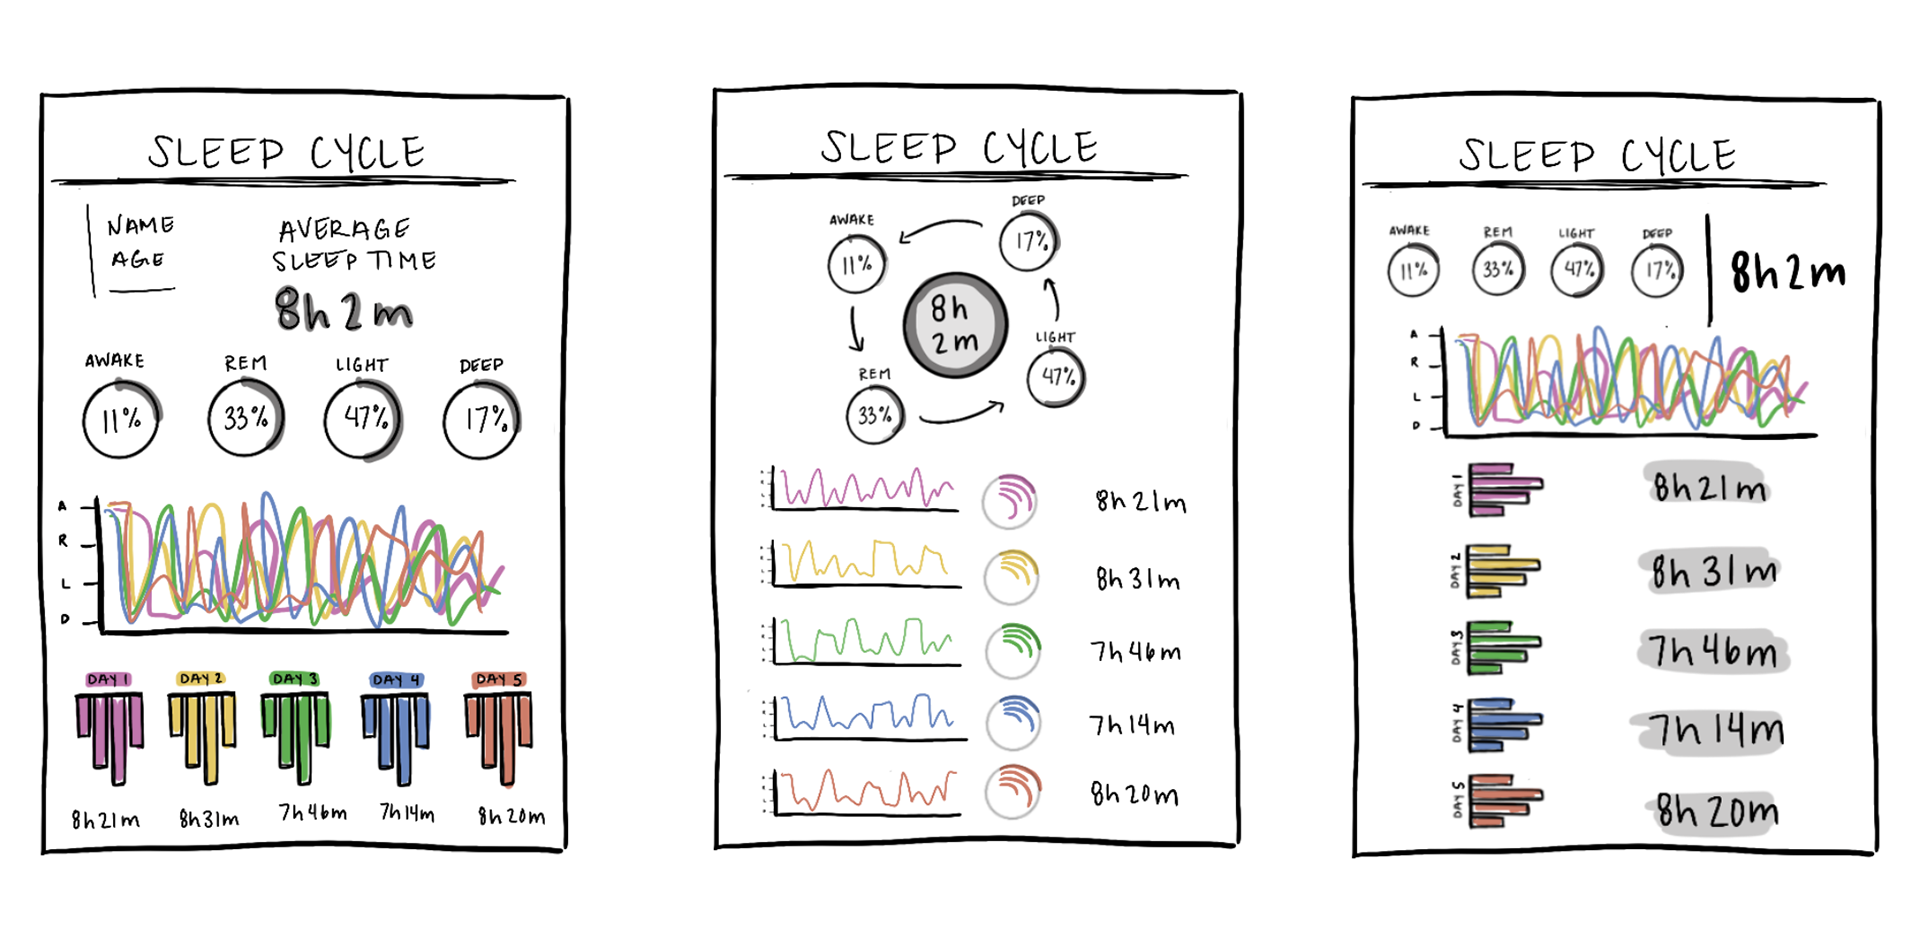
This info graphic compares my sleep cycle to the average sleep cycles of a woman my around my age. I focused on four different stages of sleep: active, REM, light, and deep sleep.
Tools Used:
Illustrator

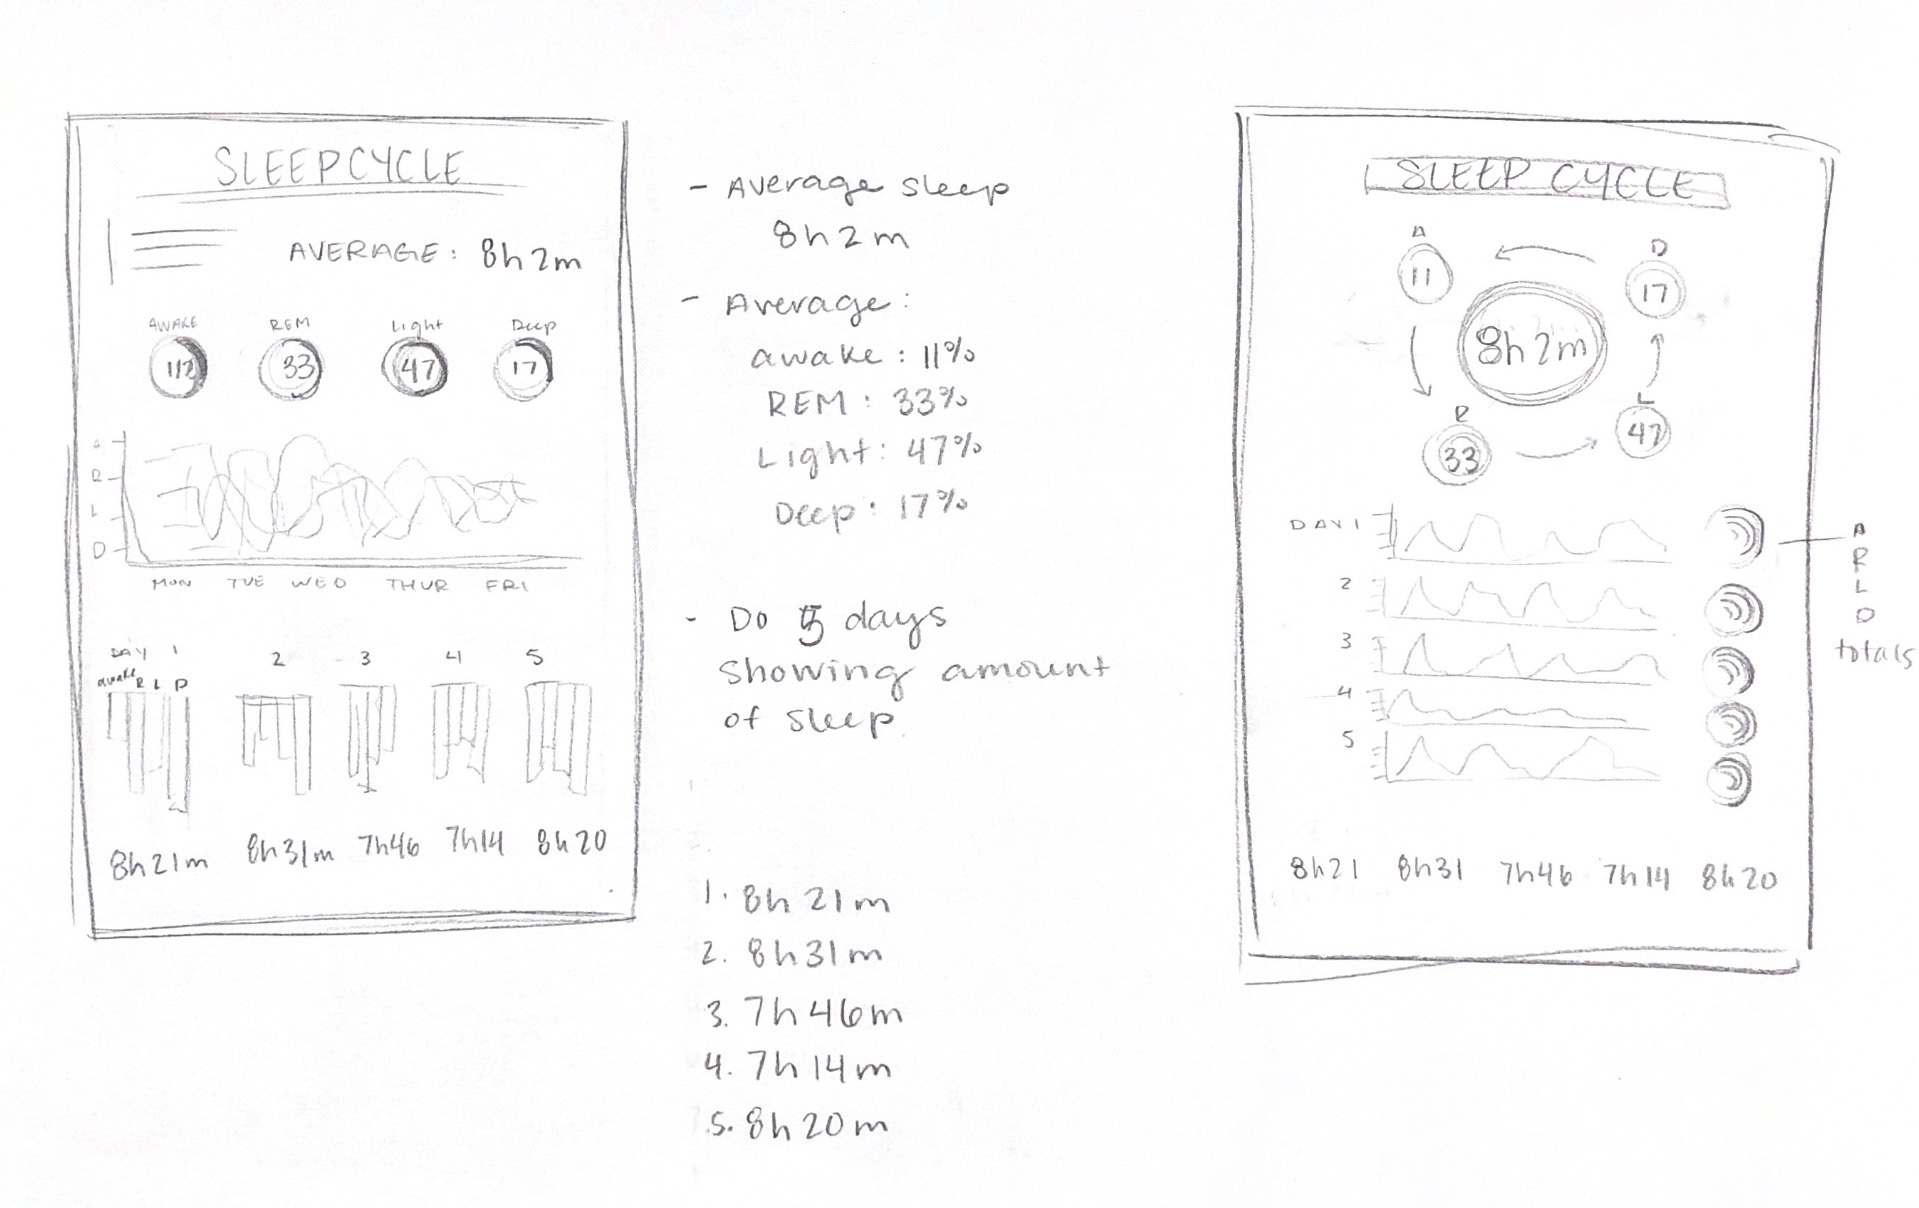
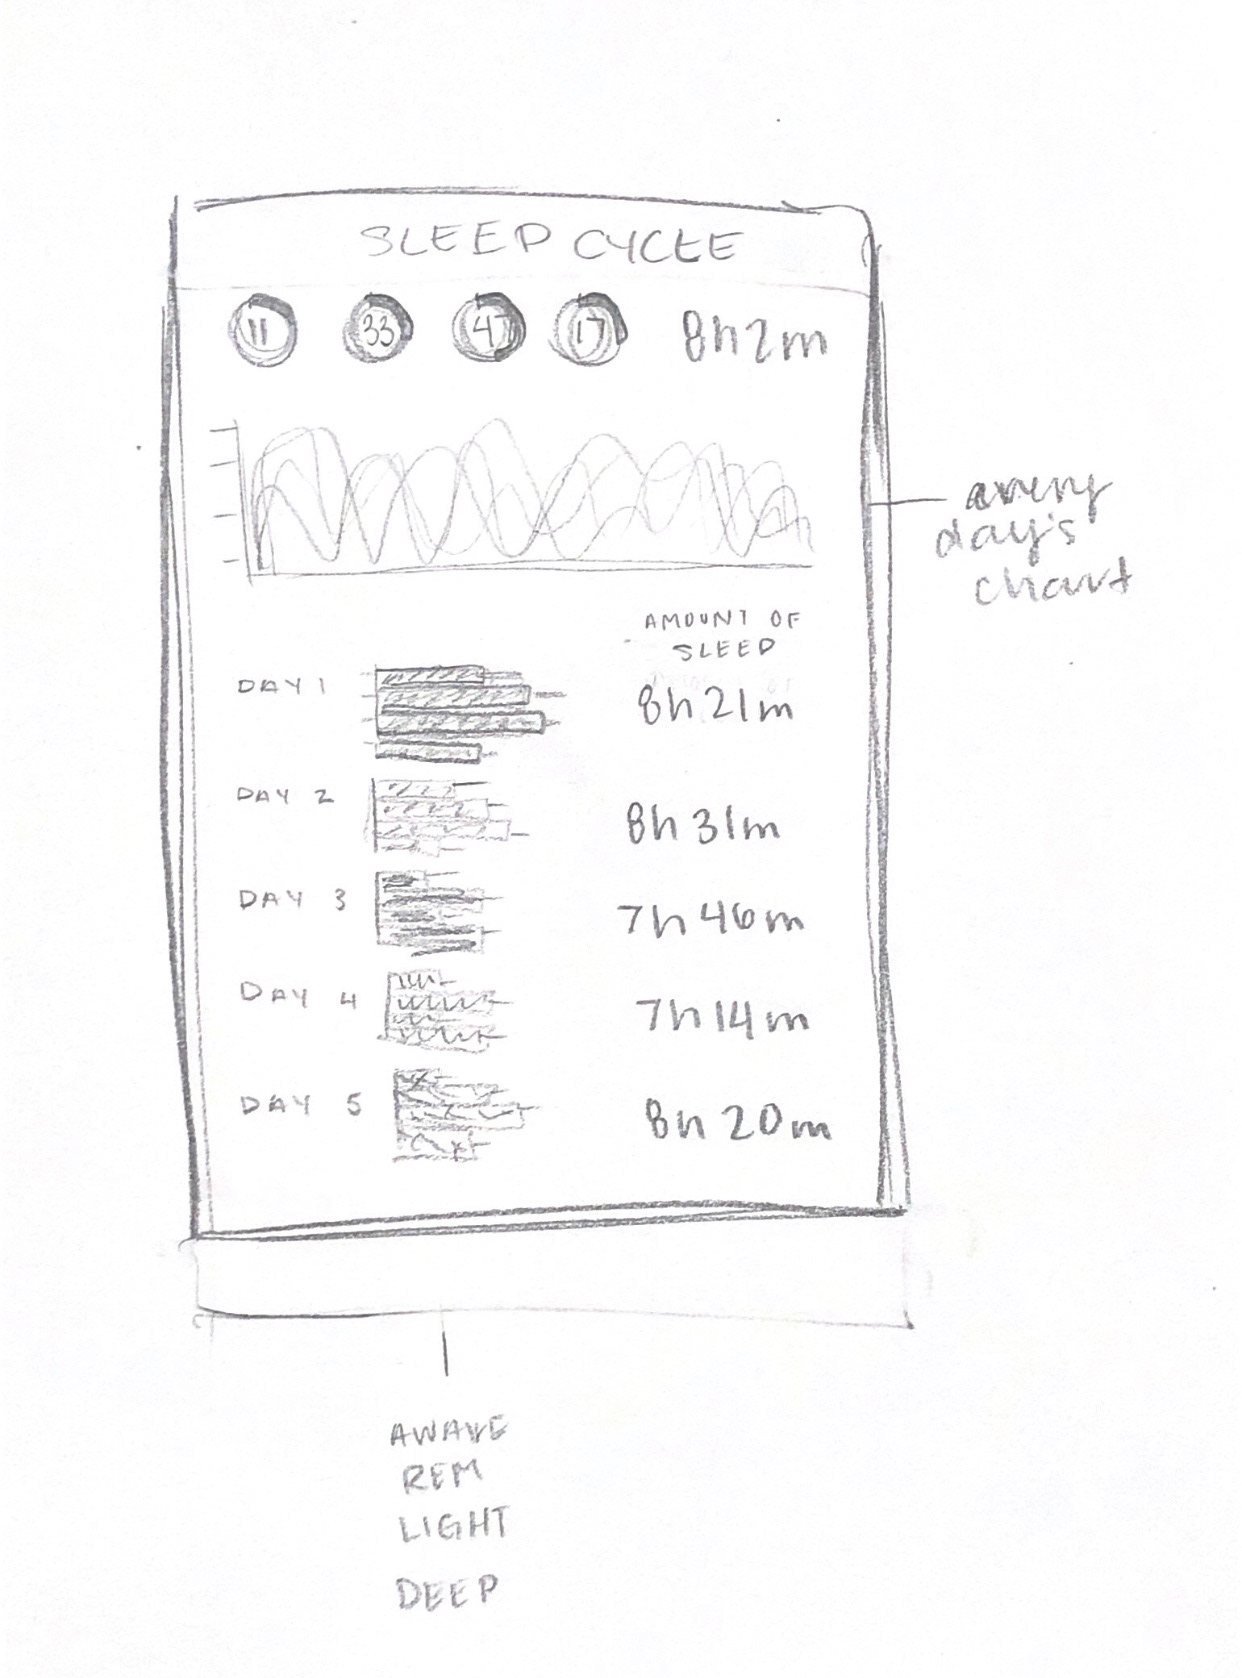
Process
Below shows my ideation process. I created three concepts for how I wanted to display my information. I also recreated each version in procreate to add color. This helped me see what type of graphics worked best in representing my data.
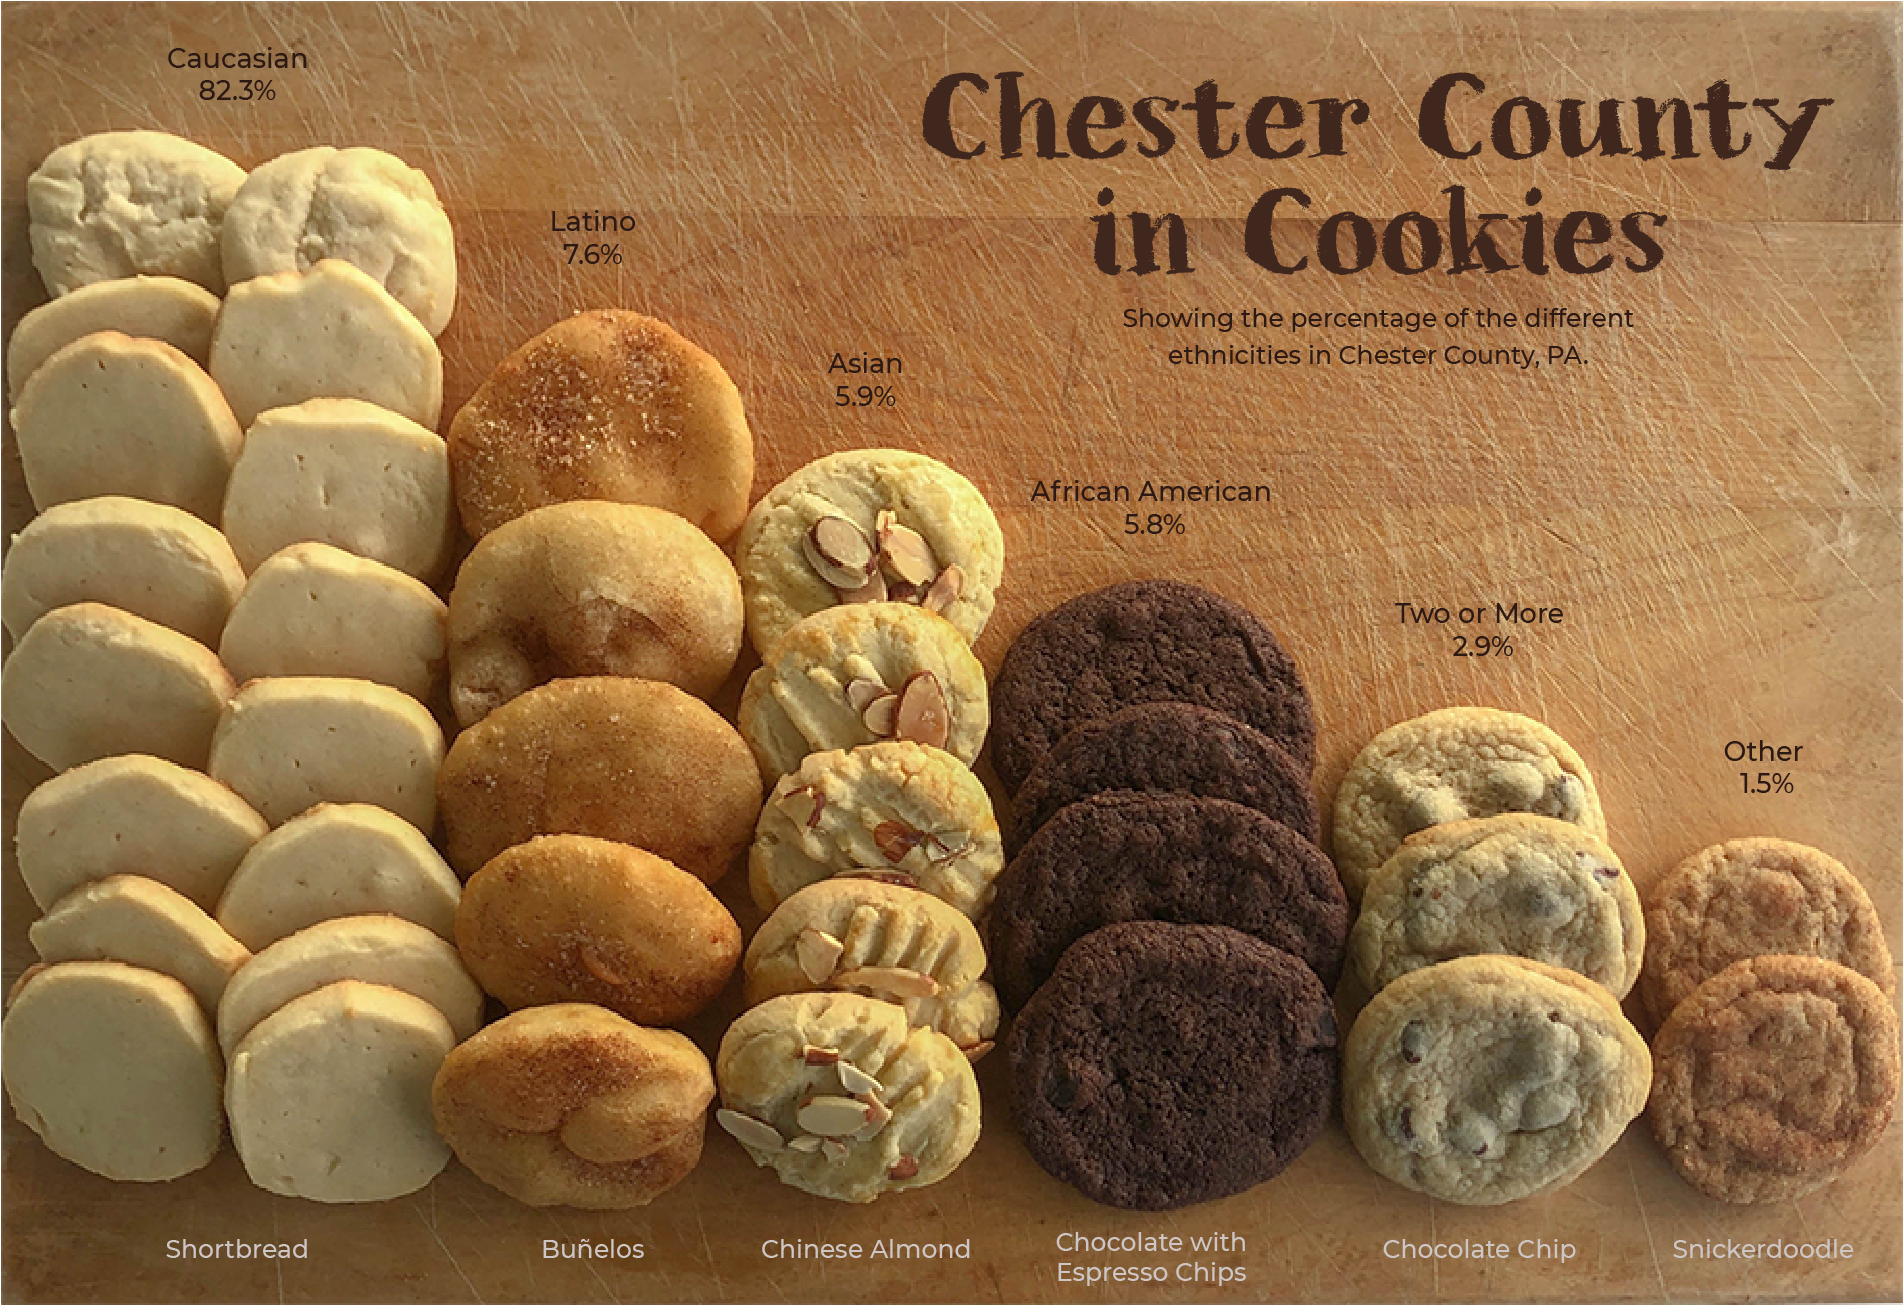
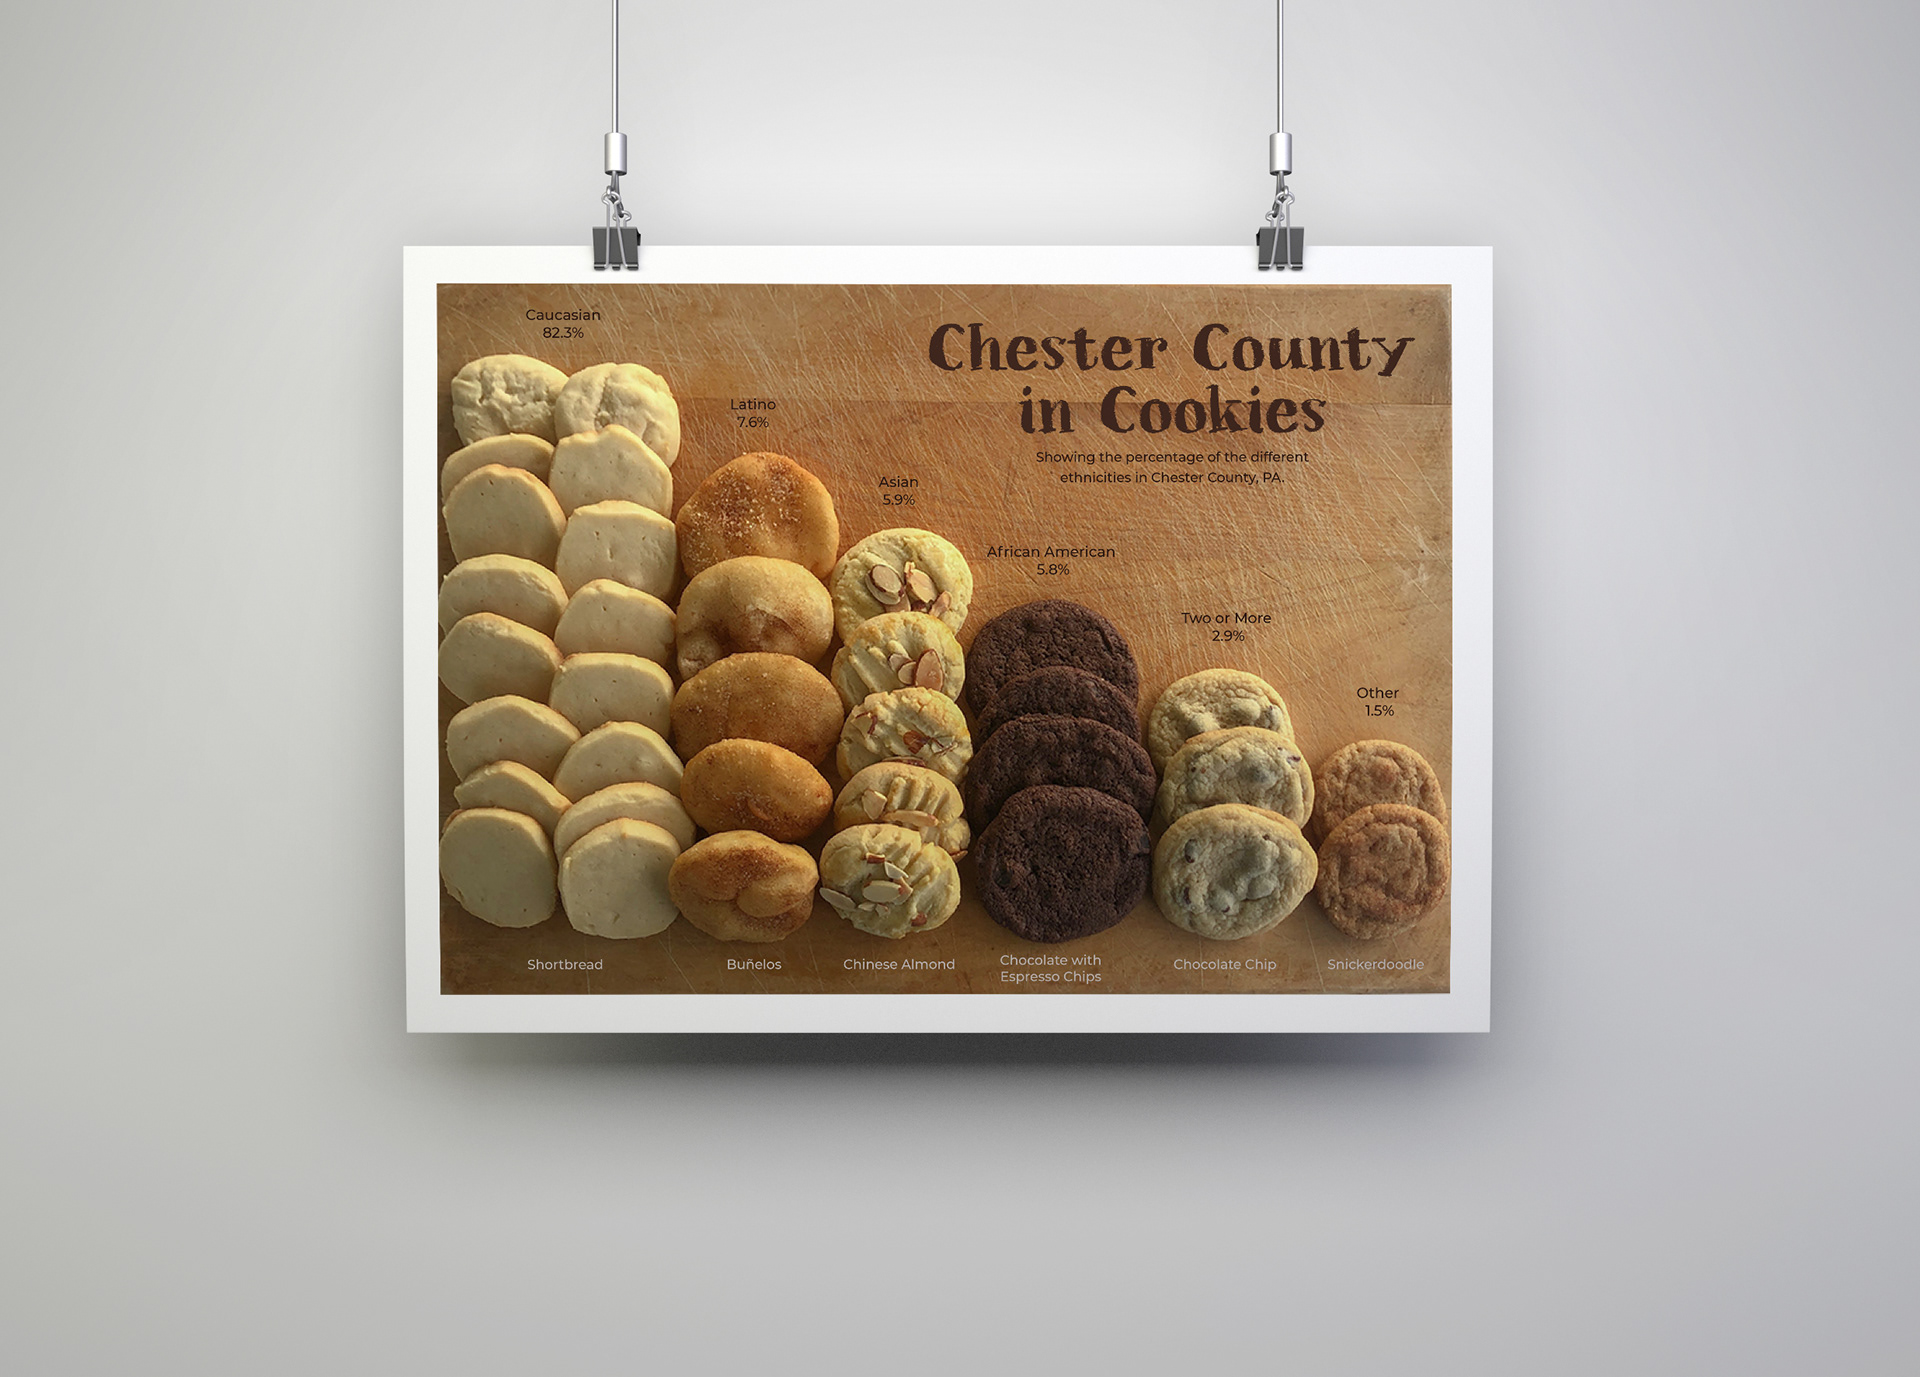
Data by Cookies
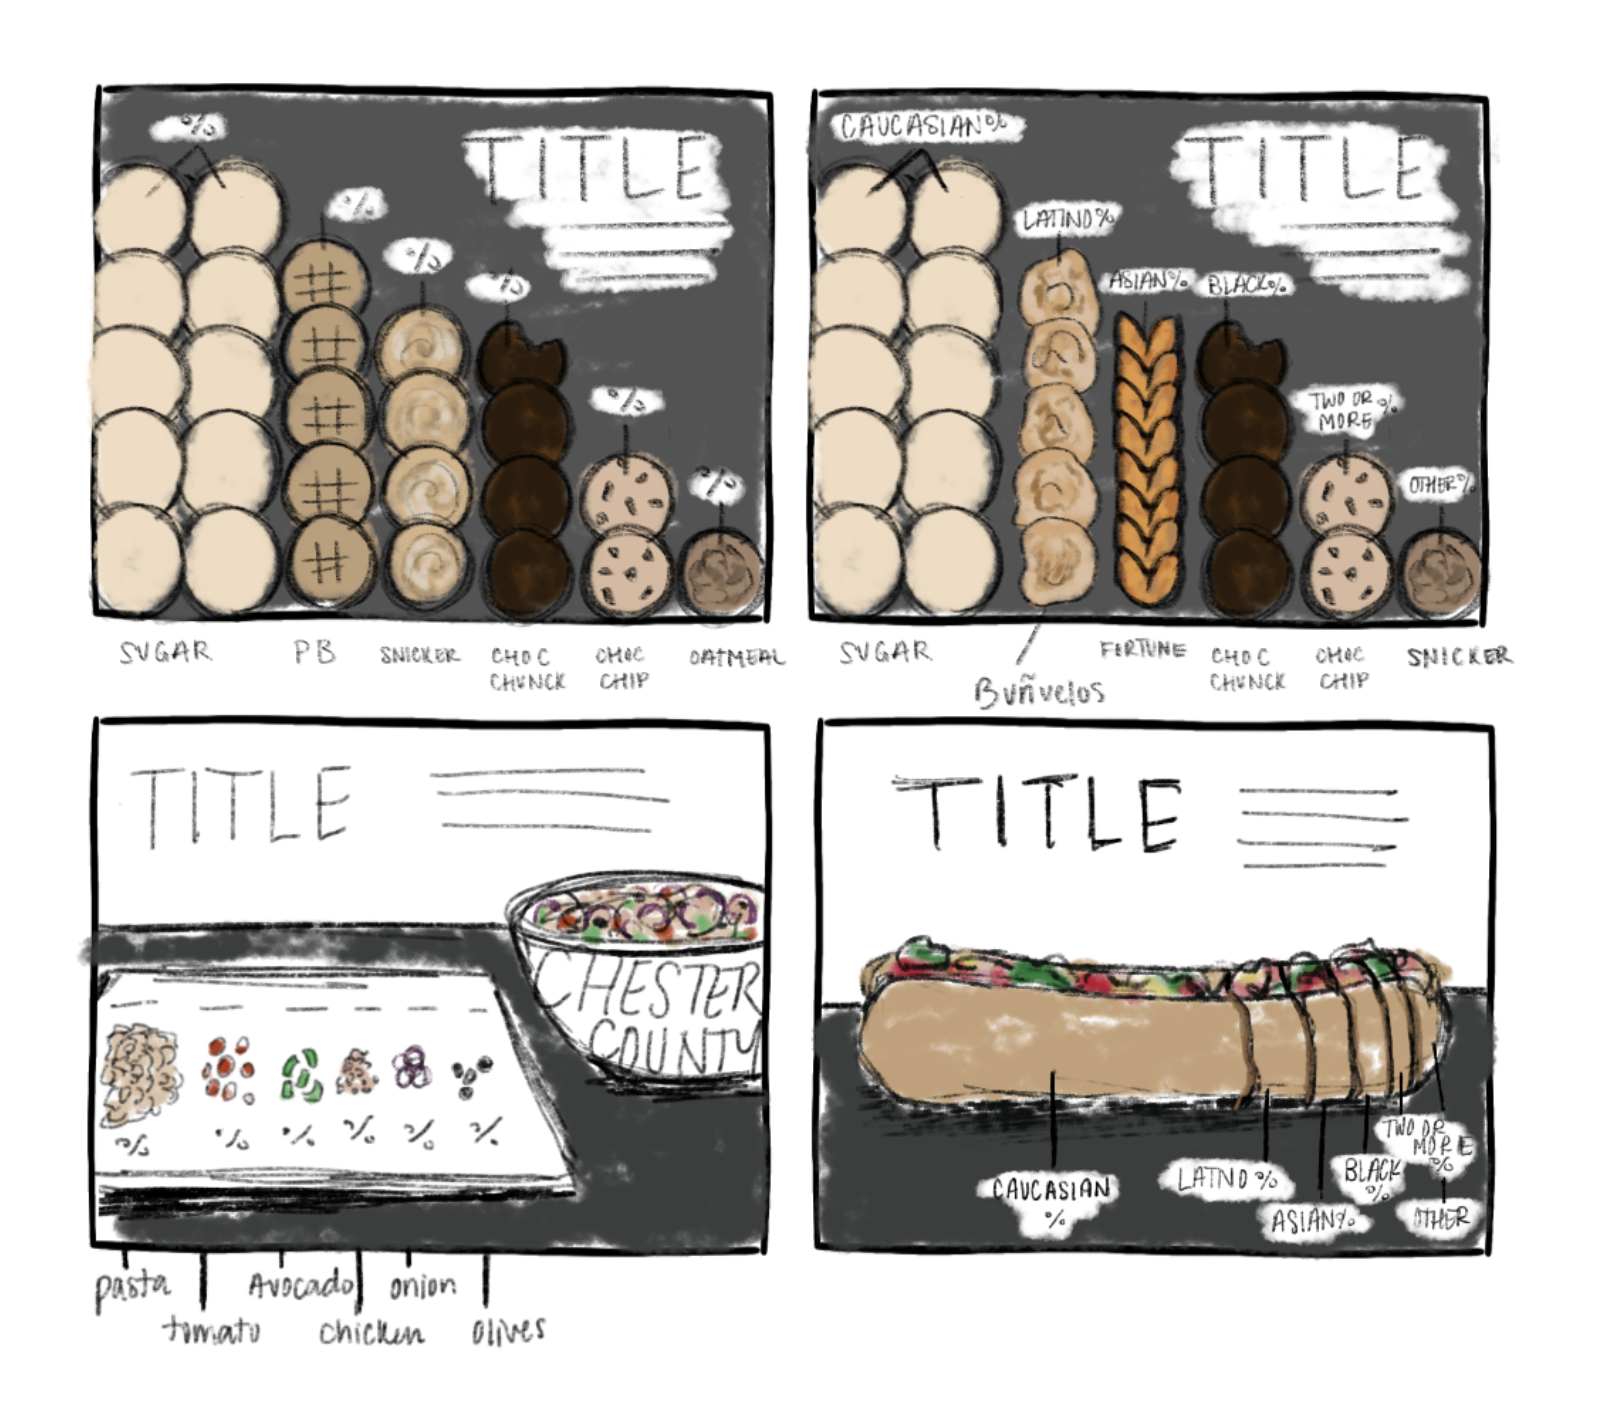
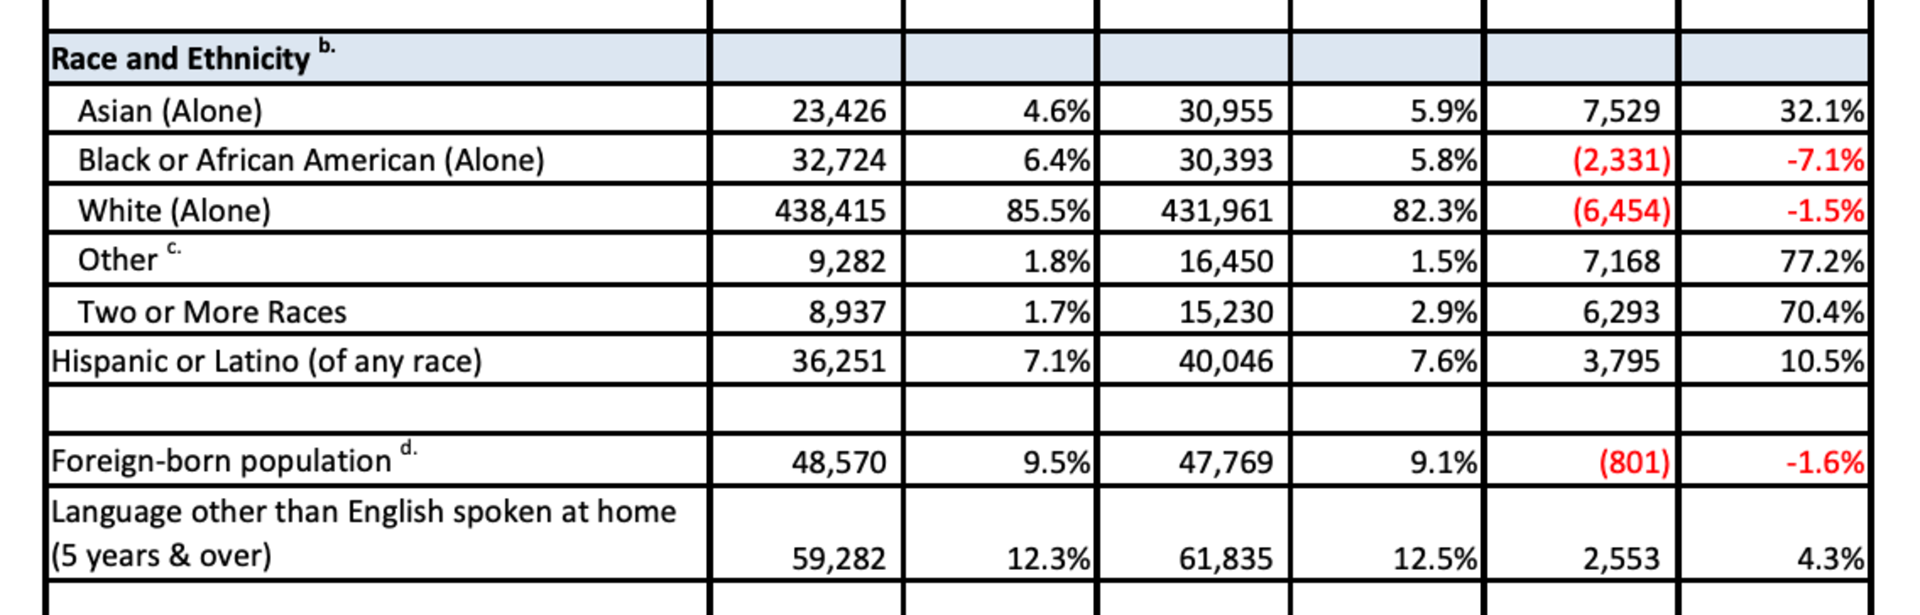
For another project, we were prompted to create an info graphic using food. I focused my data on different ethnicities in Chester County and represented each group with different cookies. I also tried to bake cookies that are popular for the ethnicities.
Tools Used:
Illustrator - Canon Camera - Cookies
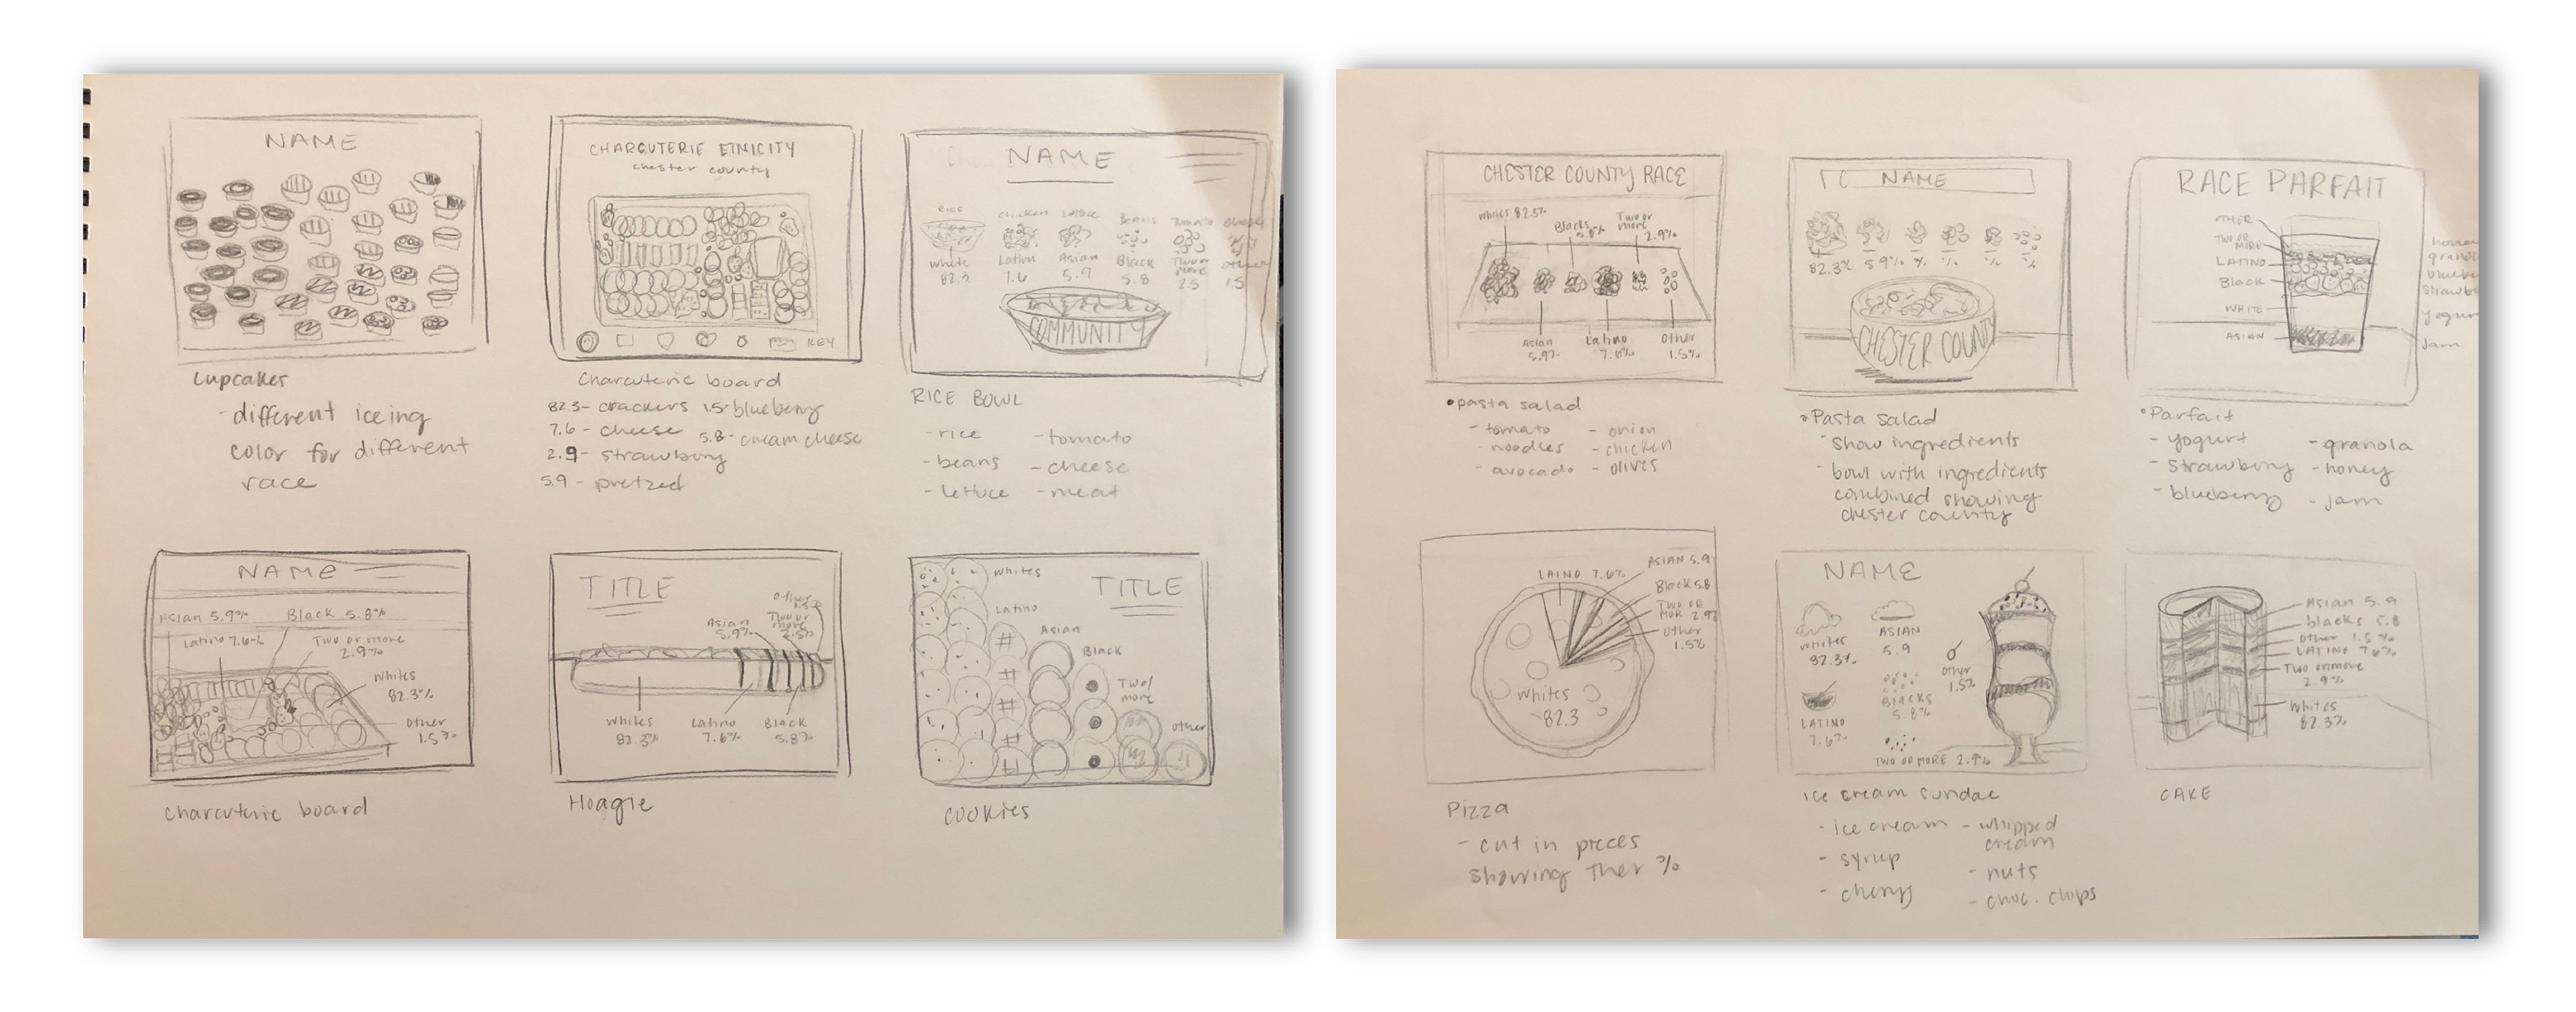
Process
Below is my ideation and sketches. I explored a few variations of food and how the data would be shown. Before deciding on cookies, I also thought of a charcuterie board, pasta bowl, hoagie, pie, and more. I thought that cookies would be best since I would be able to connect the cookies to specific ethnicities.